Hiking Difficulty Calculator
Three independent formulas (Shenandoah, Kip Yost, Petzoldt) to benchmark your hike against a variety of classics.
Metrics
Terrain & Technical
Shenandoah
8.00
Kip Yost
6.33
Petzoldt
6.96
Pro Tip: Altitude above 8,000 ft compounds exertion exponentially due to decreased oxygen saturation.
Methodology Breakdown
Shenandoah
8.00√(2 × gain × distance), piecewise-normalized for day-hike reliability.
Kip Yost (WMC)
6.33Terrain modifiers for scrambling, exposure, mileage, and altitude.
Petzoldt (NOLS)
6.96Energy miles: distance + (gain ÷ 500).
All scores normalized to a 10.0 scale against the NH Presidential Traverse.
 7.2
7.2Closest Comparison
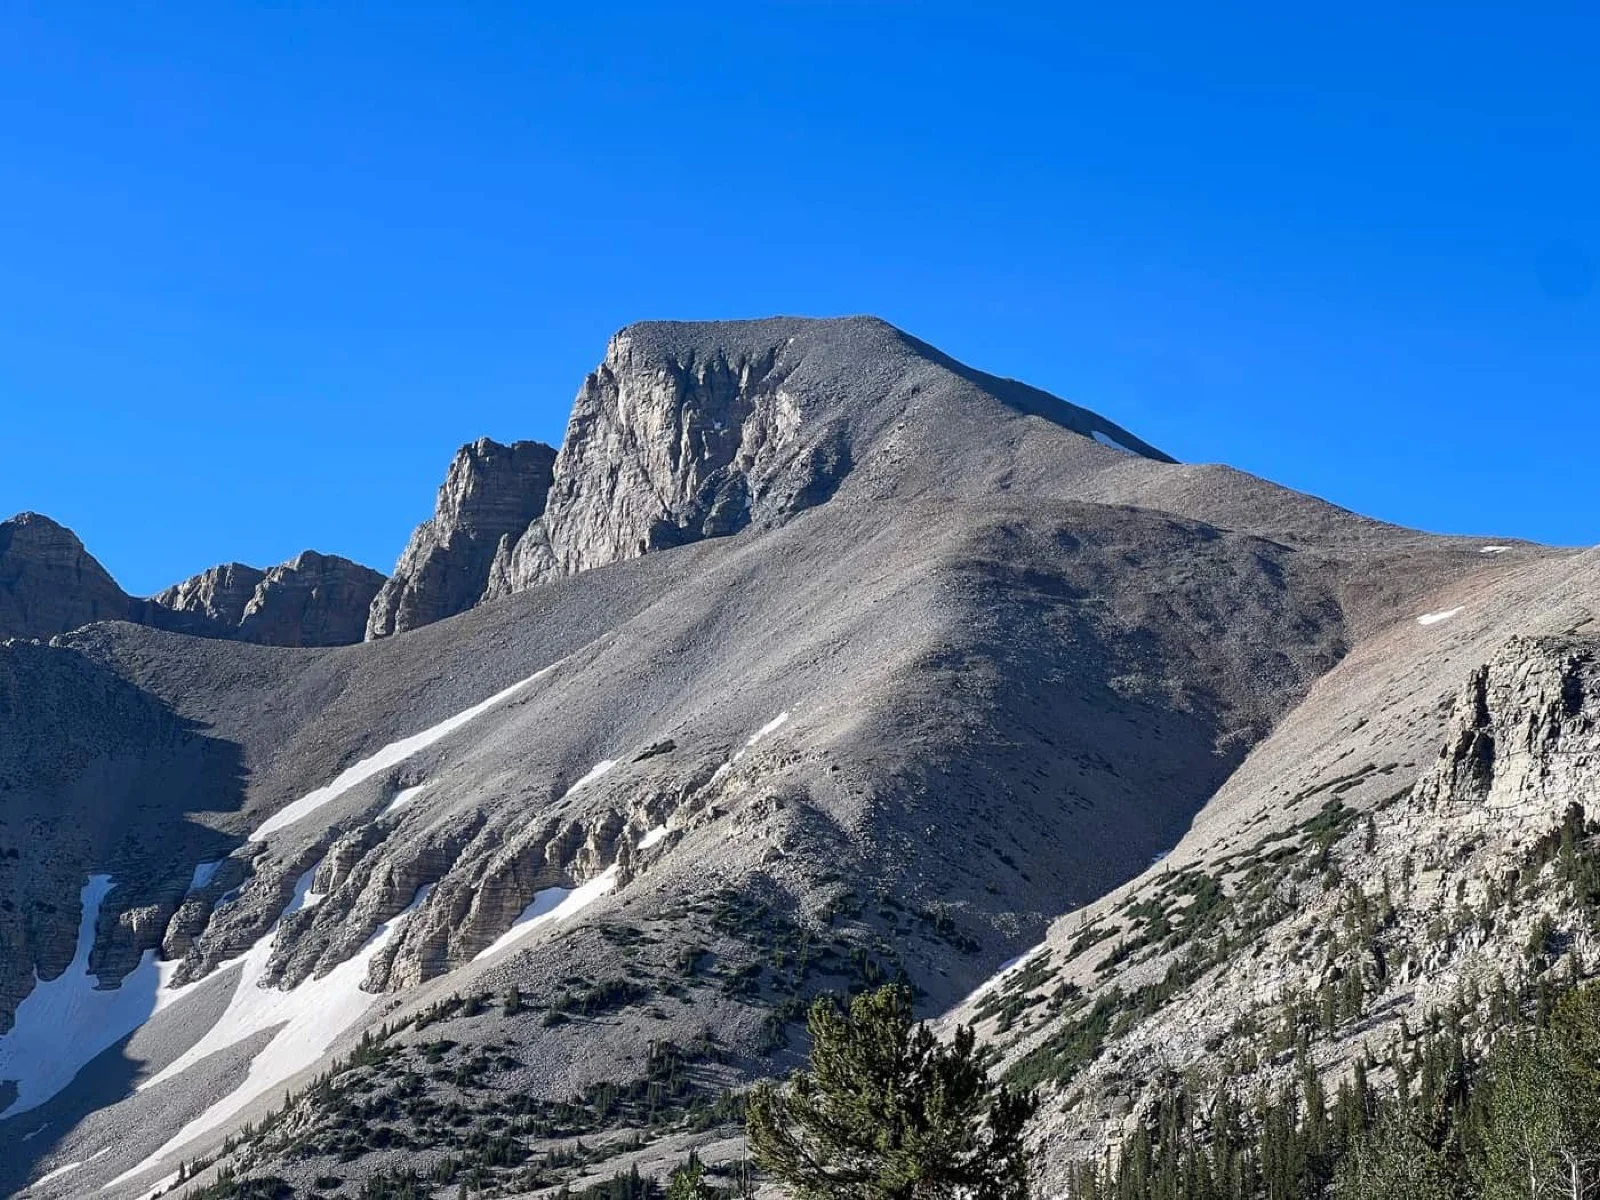
Wheeler Peak (NV)
13,063 ft summit with a 4.3-mile route featuring sustained elevation gain and high-alpine desert exposure.
View Full Trip Report →Formula Weights
The algorithm weights each formula equally—your hybrid score is a straight average (33.3% each). Kip Yost gains influence when technical modifiers are selected.
Learn about NormalizationCompare Against Reference Hikes
33 tracked peaks in the database
| Hike Name | Miles | Elev Gain | Beta Score ↓ |
|---|---|---|---|
| Wheeler Peak (NV) | 8.2 | 2,986 | 7.2 |
| Presidential Traverse (NH) | 20.4 | 8,917 | 9.6 |
| Granite Peak (MT) | 22 | 7,240 | 9.4 |
| Kings Peak (UT) | 27.5 | 4,750 | 9.2 |
| Mount Whitney (CA) | 21.4 | 6,100 | 9.1 |
| Enchantments (WA) | 19.5 | 5,250 | 8.9 |
| Mount Shasta (Avalanche Gulch, CA) | 11 | 7,200 | 8.6 |
| Half Dome (CA) | 16.2 | 4,800 | 8.5 |
| Mount Timpanogos (UT) | 15 | 4,500 | 8.3 |
| South Sister (OR) | 12.5 | 4,900 | 8.2 |
| Sahale Glacier Camp (WA, North Cascades) | 12 | 4,100 | 7.9 |
| Mount Marcy (NY) | 14.8 | 3,166 | 7.9 |
| Borah Peak (ID) | 8.2 | 5,300 | 7.9 |
| Mount Katahdin (ME, Hunt Trail) | 10.4 | 4,200 | 7.8 |
| Mount Mitchell (NC) | 11.8 | 3,694 | 7.8 |
| Telescope Peak (CA, Death Valley) | 12.6 | 3,200 | 7.7 |
| Mount Saint Helens (WA) | 8.5 | 4,500 | 7.7 |
| Mount Hood (OR, South Side) | 6 | 5,300 | 7.7 |
| Mount Washington (NH, Tuckerman Ravine) | 7.2 | 4,250 | 7.5 |
| Guadalupe Peak (TX) | 8.4 | 3,000 | 7.3 |
| Grinnell Glacier (MT) | 10.6 | 1,630 | 6.9 |
| Camel's Hump (VT) | 4.8 | 2,350 | 5.9 |
| Angels Landing (UT) | 5.4 | 1,500 | 5.4 |
| Jenny Lake Loop (WY, Grand Teton NP) | 7.1 | 1,040 | 5.4 |
| Mount Monadnock (NH) | 3.8 | 1,750 | 5.0 |
| The Wave (AZ/UT) | 6.7 | 418 | 4.4 |
| Mirror Lake (CA, Yosemite, loop) | 4.4 | 305 | 3.3 |
| Delicate Arch (UT) | 3.2 | 480 | 3.2 |
| Grotto Falls (TN) | 2.6 | 585 | 3.2 |
| Clingmans Dome / Kuwohi (TN) | 1 | 337 | 2.5 |
| Grand Prismatic Spring Overlook (WY) | 1.6 | 200 | 2.4 |
| Mesa Arch (UT, Canyonlands) | 0.6 | 65 | 1.5 |
| Bridalveil Falls (CA, Yosemite) | 0.5 | 85 | 1.0 |
Click column headers to sort. Your comparable hike is highlighted.
How Hiking Difficulty Ratings Work
Most hiking apps and guides use vague terms: "moderate," "strenuous," "expert." Hikers interpret those differently depending on fitness, experience, and what they did last weekend. A standardized rating system eliminates the guesswork.
This calculator uses three established mountaineering formulas, each developed to measure difficulty from a different angle. They don't always agree. And that's the point. A hike that's physically brutal (high elevation gain, short distance) might score differently from a hike that's technically complex (scrambling, exposure, route-finding).
The three formulas:
The Shenandoah metric measures raw difficulty: √(2 × elevation gain × miles). It's pure physics. Park rangers in Virginia have used this formula for over 50 years because it's reliable and doesn't require subjective judgment. It excels at quantifying sustained physical effort.
The Kip Yost method (Wasatch Mountain Club, 1995) adds technical modifiers: scrambling, boulder fields, ridgeline navigation, and exposure. It recognizes that a 10-mile hike with Class 3 scrambling is harder than a flat 10-mile trail. Alpine and backcountry communities favor it because it accounts for terrain you can't just power through.
The Petzoldt Energy Miles system (NOLS, 1976) estimates effort using a simple formula: miles + (elevation gain / 500). It's elegant in simplicity and widely taught in mountaineering schools worldwide. It correlates directly with how tired you'll actually be.
Why we use all three:
A single formula would miss important dimensions. By averaging them, we capture the full picture: raw physics, technical complexity, and energy expenditure. When they disagree, that's often the most useful information. A hike's difficulty isn't just about miles or elevation. It's about what you're actually doing on the mountain.
No formula can fully capture factors like altitude acclimatization, weather, trail conditions, pack weight, or individual fitness. The calculator estimates objective route difficulty, not how difficult a hike will feel for a specific person. If a route involves Class 5 rock climbing, the Yosemite Decimal System already defines that difficulty precisely. Use it instead. This calculator is designed for day-hiking and scrambling (up to Class 4), not technical climbing.
The benchmark:
The Presidential Traverse in New Hampshire (20.4 miles, 8,917 feet of elevation gain, exposed alpine ridgeline) rates 10.0. It's the ceiling. Everything else scales against it. A 10.0 means serious conditioning, exposure management, and weather awareness are non-negotiable.
The Presidential Traverse sits near the practical ceiling for non-technical day-hiking. Multi-day expeditions, technical alpine climbs, and extreme-altitude routes exist, but they require different skills and aren't what this calculator is designed to measure.
Understanding these differences helps you choose hikes that match your skills, not just your fitness. A 7.0 that's high elevation (Petzoldt-heavy) will hit you differently than a 7.0 that's technical (Kip Yost-heavy).
Shenandoah Metric
Raw difficulty = √(2 × elevation gain × distance). Based on Virginia hiking data—simple, reliable, and calibrated for rolling day hikes.
Kip Yost (1995)
Wasatch Mountain Club formula incorporating technical modifiers—scrambling, ridgeline travel, boulder fields, exposure, elevation, and mileage.
Petzoldt (1976)
NOLS Energy Miles model = miles + (elevation gain ÷ 500). Elegant simplicity widely used in mountaineering schools for caloric planning.